Gel electrophoresis is a fundamental technique in molecular biology that allows scientists to separate and analyze DNA, RNA, or proteins based on their size and charge.
Here you will learn the how to read gel electrophoresis results.
Materials Required gel electrophoresis
- Gel electrophoresis apparatus
- Agarose gel or polyacrylamide gel
- Electrophoresis buffer
- DNA, RNA, or protein samples
- Loading dye
- DNA ladder or molecular weight markers
- Power supply
How to operate gel electrophoresis
Before we dive into reading the results, let’s briefly review the gel setup:
- Gel Casting: Prepare the gel by mixing agarose or polyacrylamide with electrophoresis buffer, and pour it into a gel mold. Insert comb(s) to create wells for sample loading.
- Sample Preparation: Mix your DNA, RNA, or protein samples with loading dye to give them color and density for loading.
- Electrophoresis: Submerge the gel in the electrophoresis buffer and connect it to the power supply. Apply an electric current, causing your samples to migrate through the gel based on their size and charge.
- Staining and Visualization: After electrophoresis, stain the gel with a suitable dye (e.g., ethidium bromide) and visualize the results under UV light.
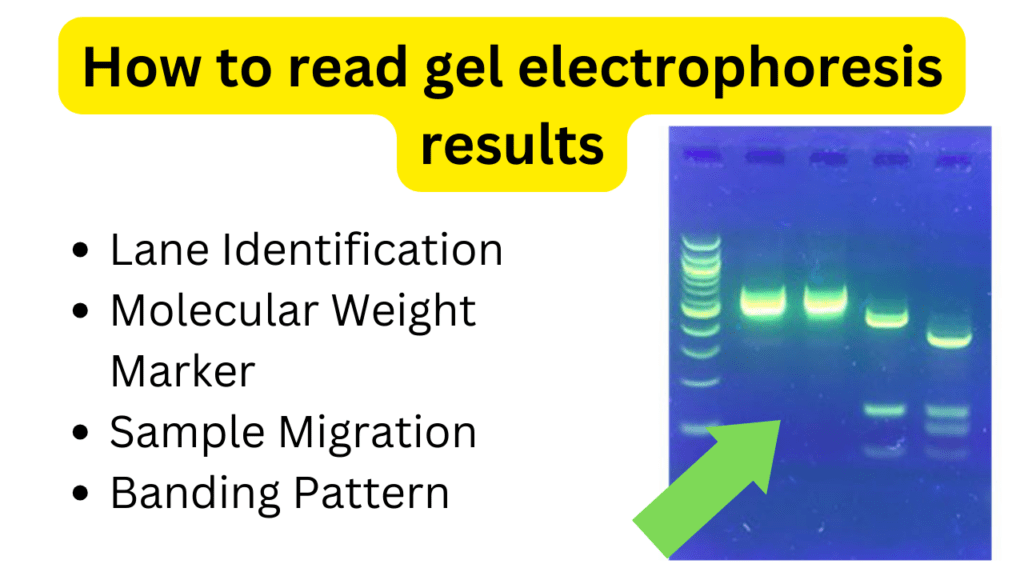
How to read gel electrophoresis results
- Lane Identification: In a gel, you will see lanes that correspond to each sample loaded. These lanes appear as distinct tracks running horizontally. Each lane represents a different sample.
- Molecular Weight Marker: A standard lane with a ladder of known DNA fragments (molecular weight markers) is included. These markers help determine the size of your samples.
- Sample Migration: DNA, RNA, or proteins migrate through the gel with smaller fragments moving faster and traveling further from the well. The larger fragments remain closer to the well.
- Banding Pattern: Observe the gel for the presence of bands. Bands are the distinct regions of concentrated DNA, RNA, or proteins. Each band corresponds to a particular fragment of the molecule.
- Band Size: Compare the migration of your sample bands to the molecular weight markers. Smaller fragments will be closer to the bottom, while larger ones will be near the top. The ladder provides a size reference.
- Band Intensity: The intensity of a band can vary, indicating the quantity of DNA, RNA, or proteins in that fragment.
- Smearing: Sometimes, you may observe smears instead of distinct bands. This suggests a range of fragment sizes rather than discrete fragments.
- Gel Documentation: Use a gel documentation system or a smartphone with an appropriate app to capture and save gel images for further analysis.